Right-of-Way & Encroachment · Energy
What has been built beside my line since the last class-location study?
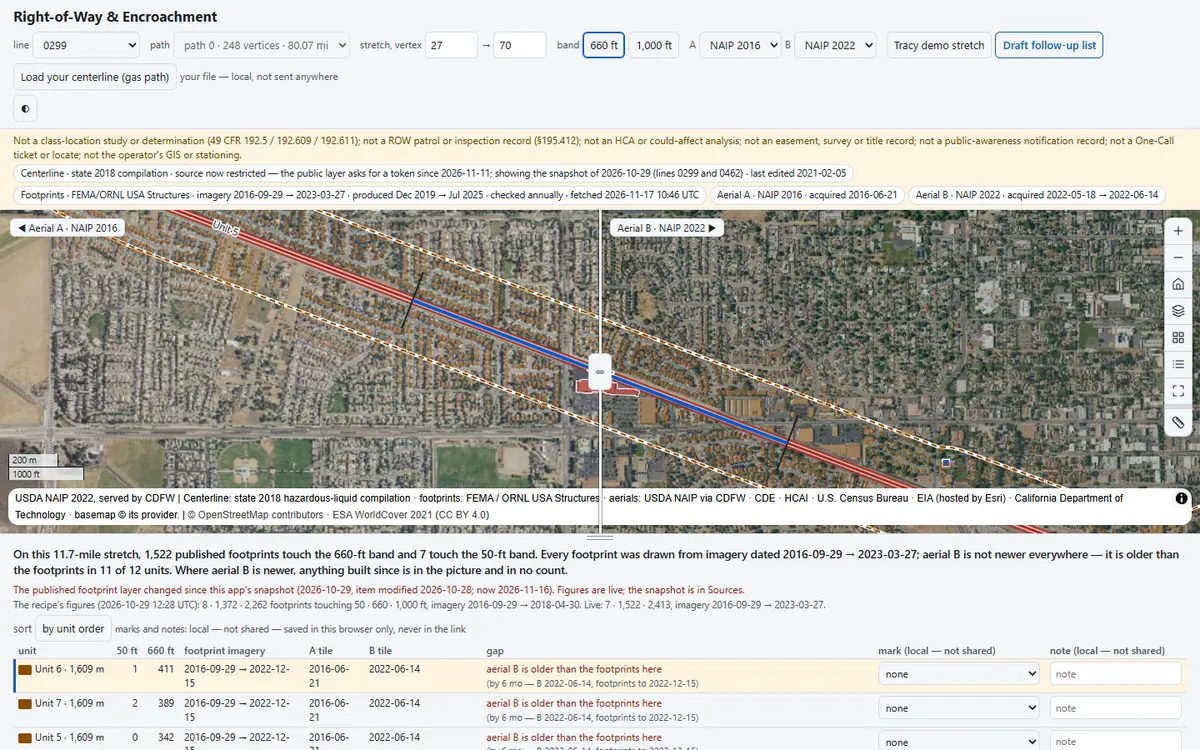
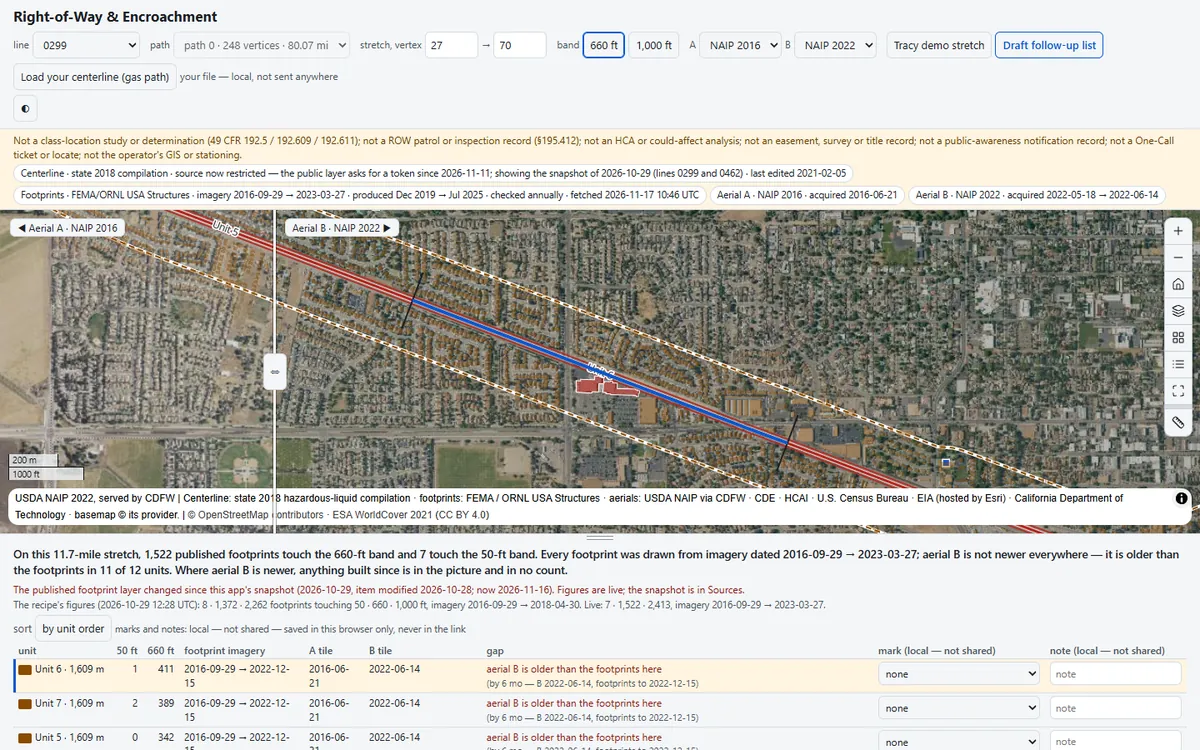
Counts the published structures within 50 ft and 660 ft of a pipeline centerline, mile by mile, with the date of the imagery behind each count, and puts two dated aerials side by side so you can see where the ground has changed since.
Before you open it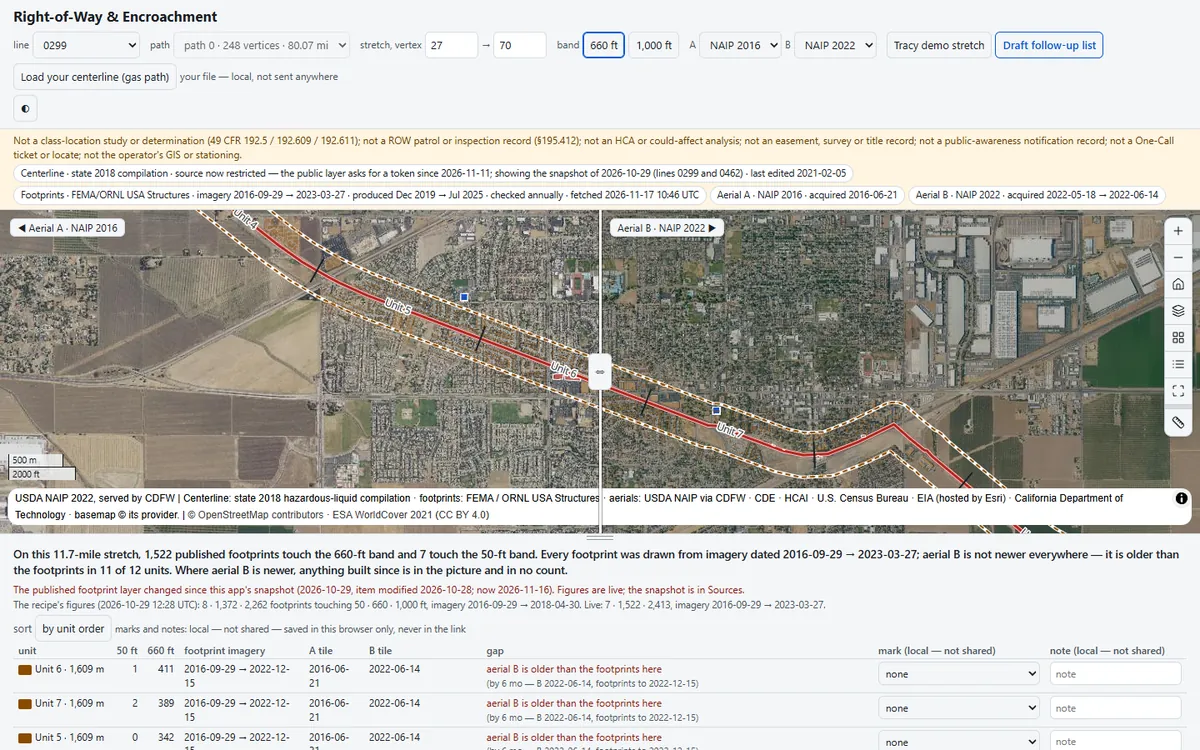 1
 2
 3
What you'll do in the app
1Read the stretch11.7 miles near Tracy: 1,522 footprints touch the 660-ft band and 7 the 50-ft band.
2Swipe the aerialsPick unit 6 (411 footprints) and drag the divider: the 2022 aerial is older than its footprints.
3Mark and exportMark a mile with a note, then take the draft follow-up list: units, footprints and a print sheet.
Demo dataFEMA/ORNL USA Structures, NAIP 2016 and 2022, and a dated snapshot of the state’s 2018 centerline
Standard49 CFR §195.210 / §195.412 · §192.5 · PHMSA PIPA
Runs onStrata, or your existing Esri services
Built fromAn open recipe, in one run with Claude
On your own data
Want this on your own data?
We deliver it for you
We set it up on your data and your rules, load your first layers, and support it on Strata Hosted or Custom.
Delivery, licence and annual supportKeep exploring
All 4 Energy apps →Explore similar apps
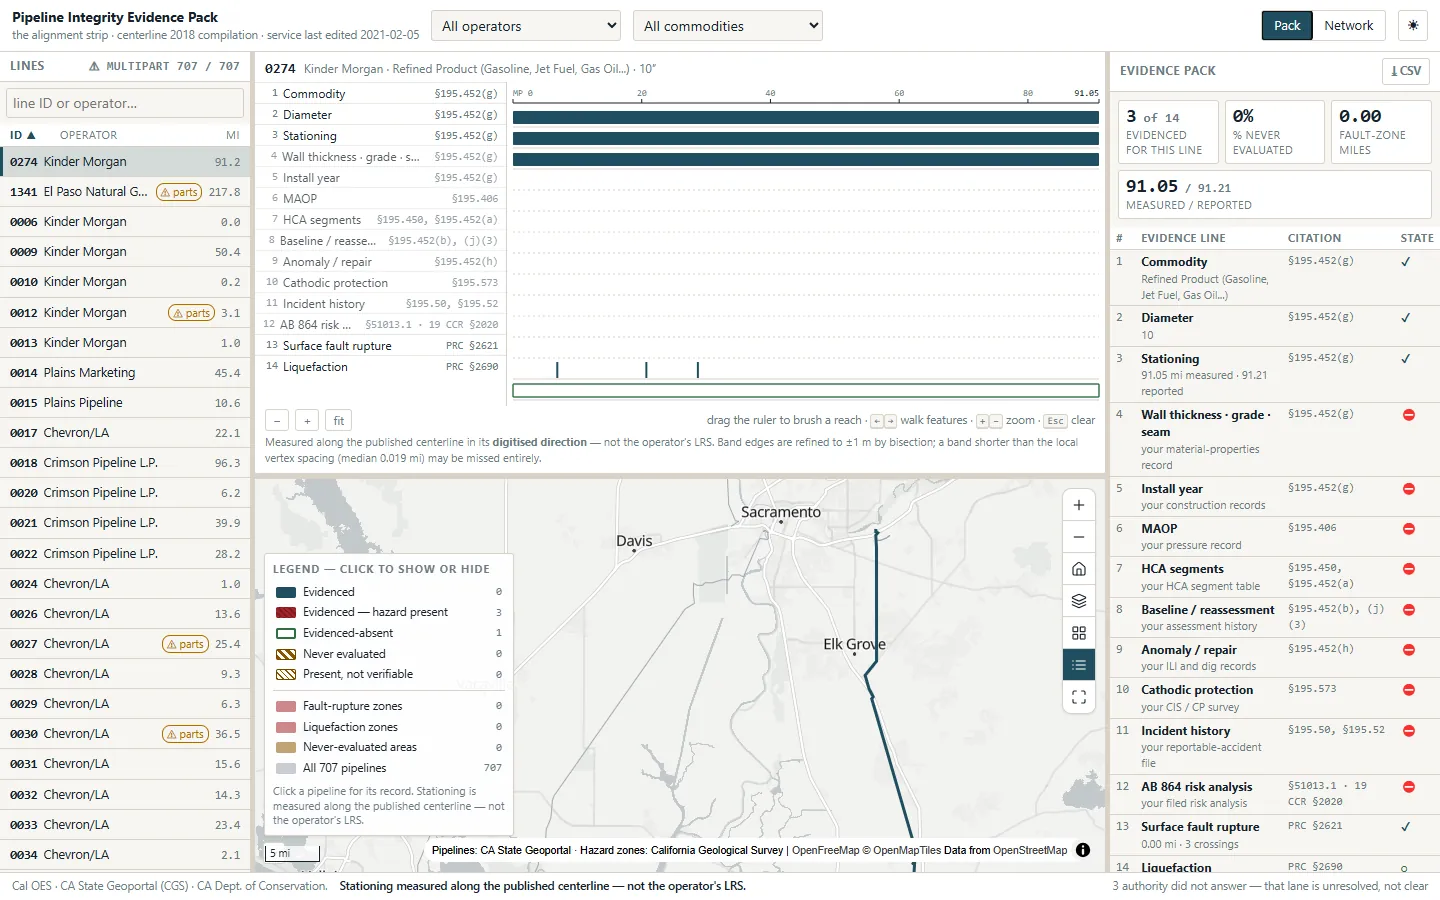
Pipeline Integrity Evidence PackWhat can we prove about this pipeline, milepost by milepost?See the app →
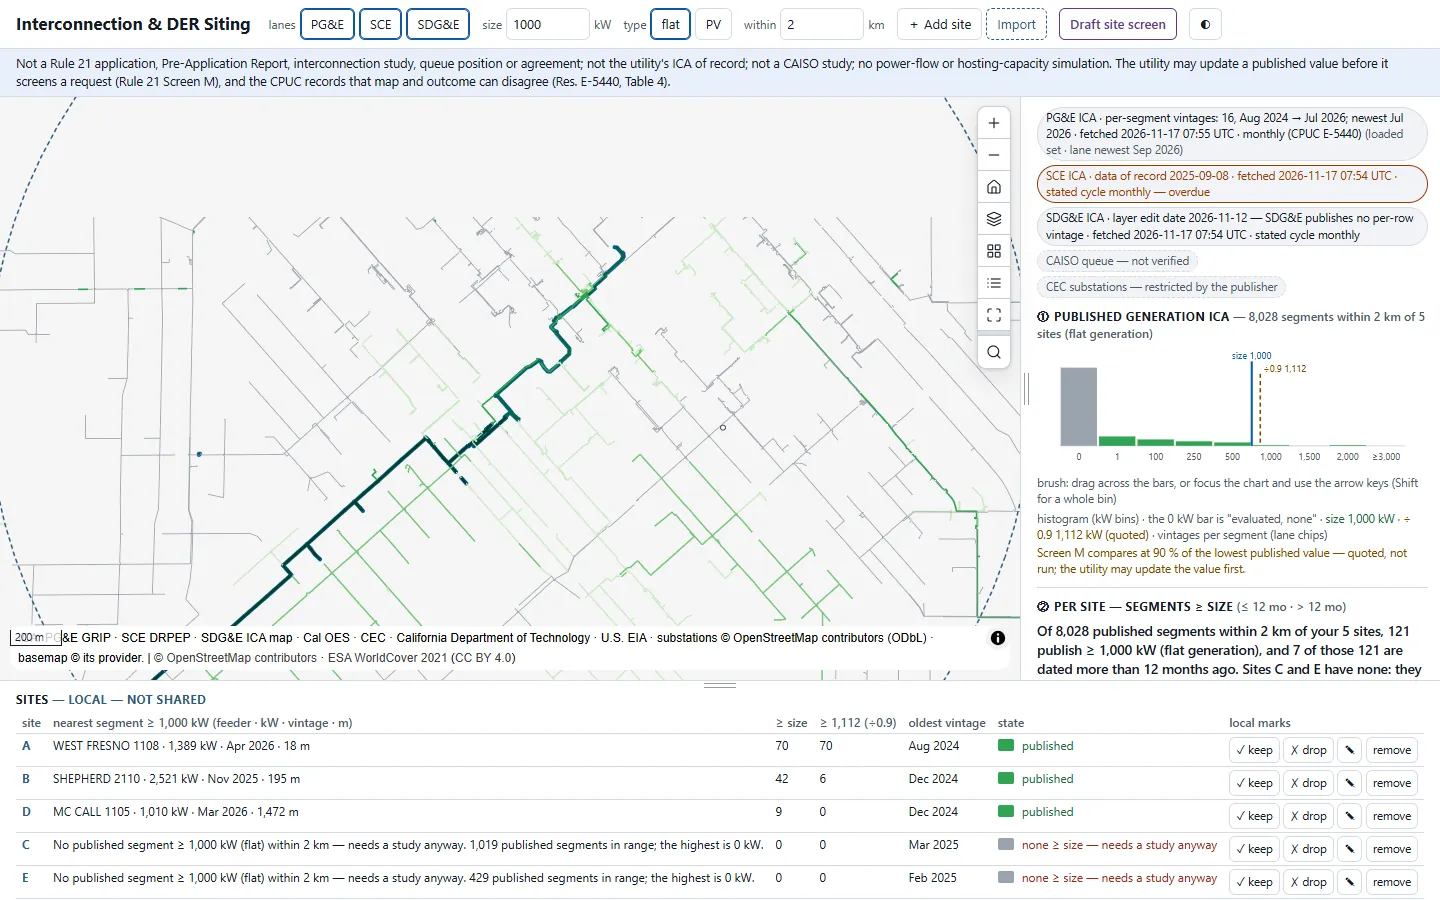
Interconnection & DER SitingWhich feeder can take my project before I pay a study deposit?See the app →
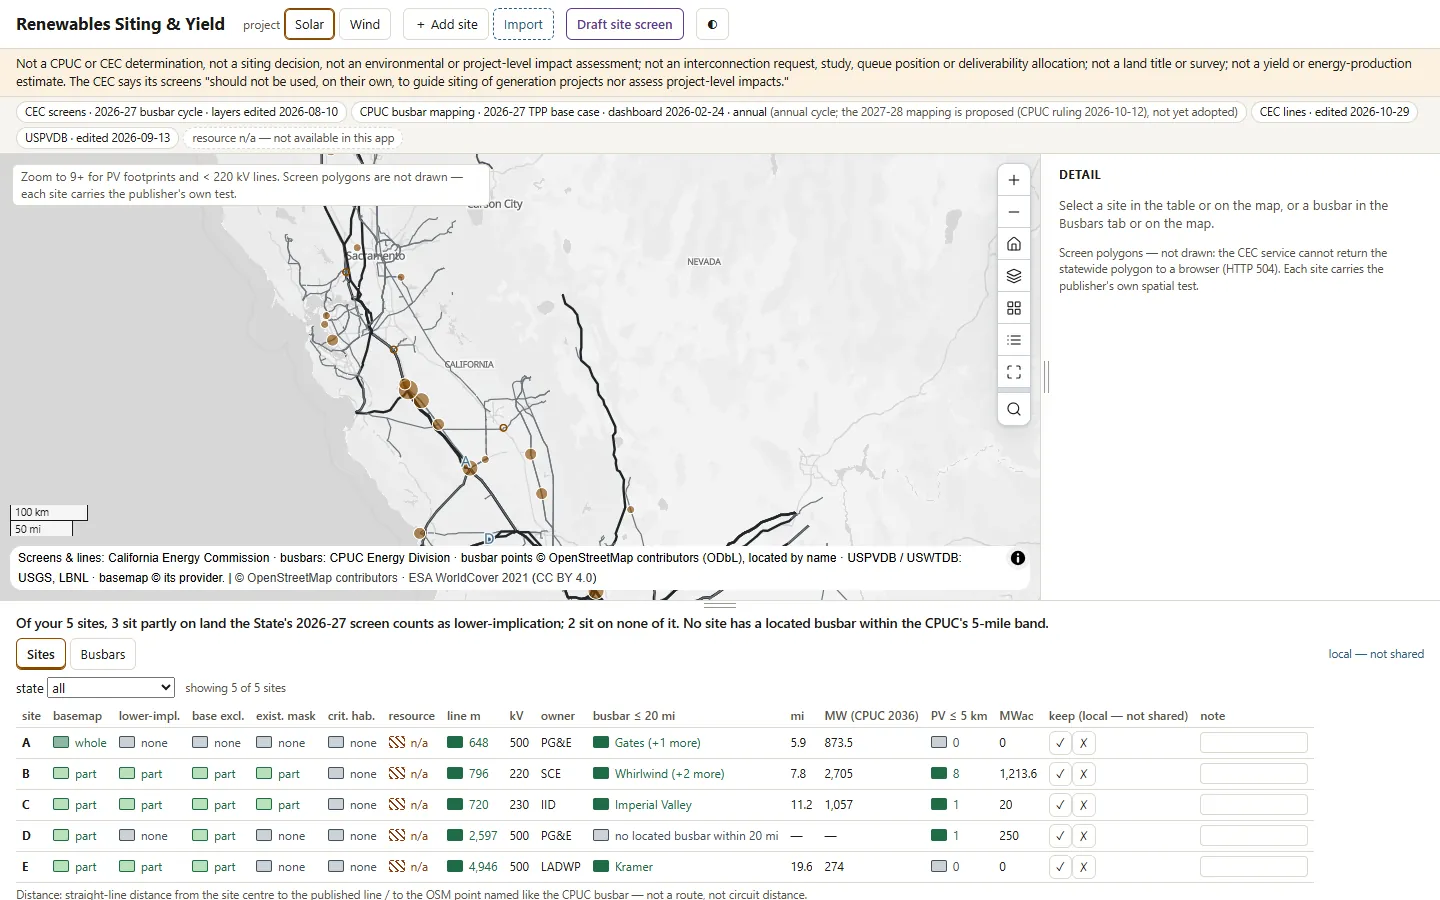
Renewables Siting & YieldWhat does the State's plan say about this site before I option it?See the app →