Renewables Siting & Yield · Energy
What does the State's plan say about this site before I option it?
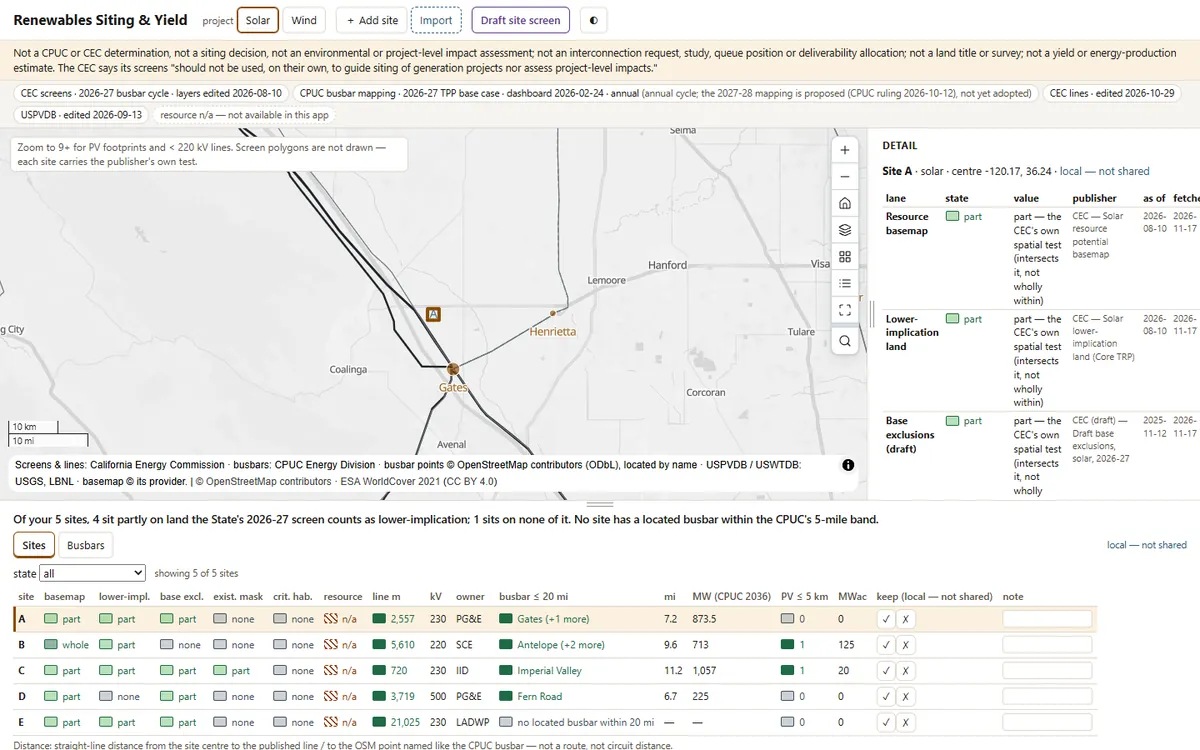
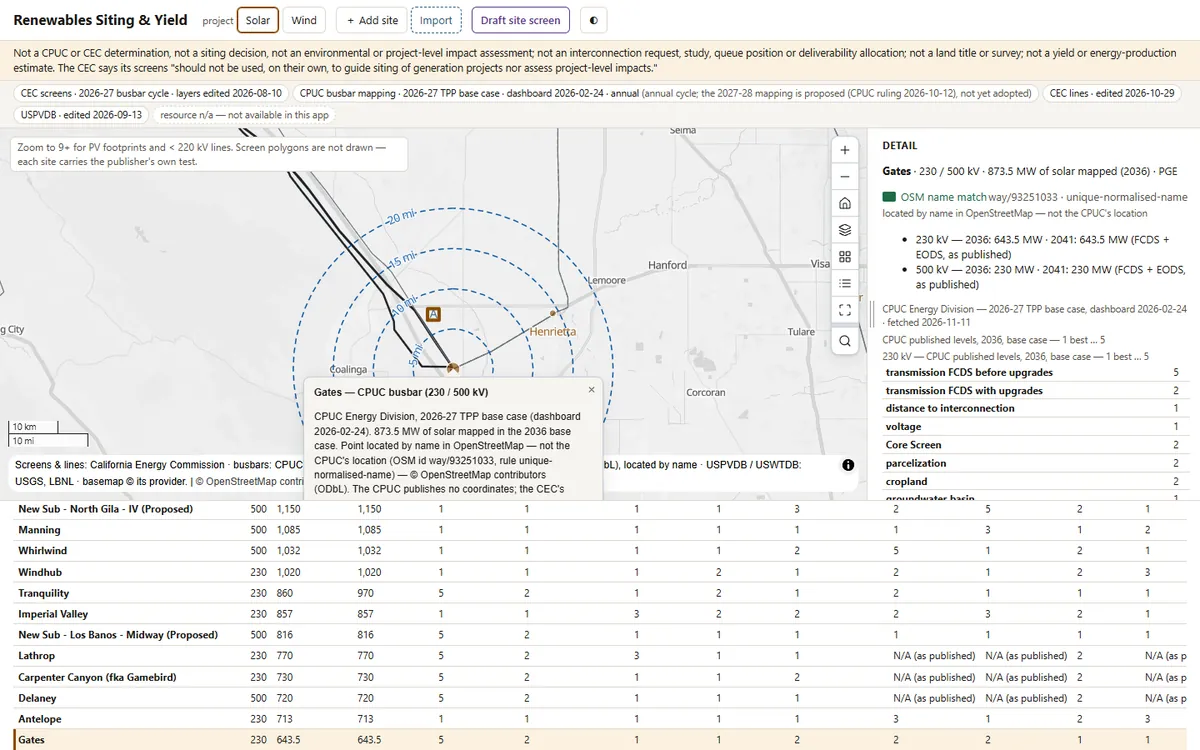
Asks the CEC’s own land-use screen about every site on a solar or wind shortlist, and puts beside it the distance to transmission and the substations the CPUC portfolio maps new generation to, each figure dated and none printed against your site.
Before you open it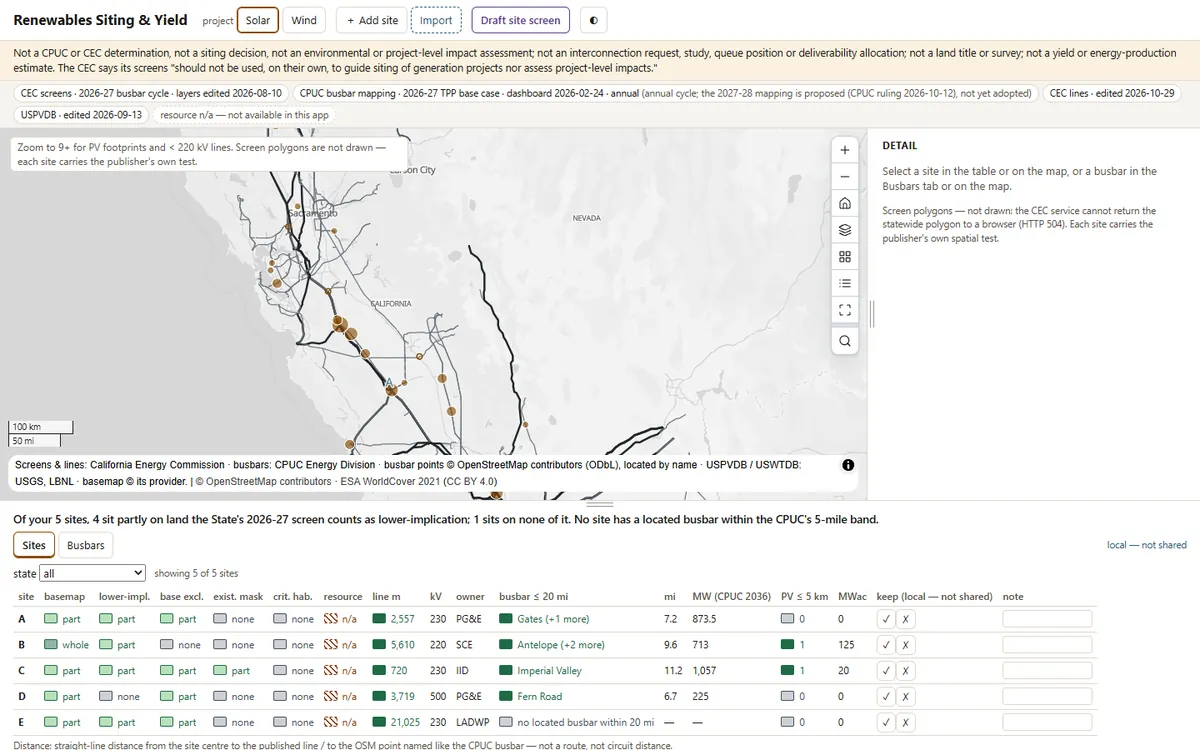 1
 2
 3
What you'll do in the app
1Import the shortlistFive sites, screened one by one: 3 sit partly on lower-implication land, 2 on none of it.
2Open a substationSite A is 648 m from a 500 kV line and 5.9 mi from Gates, where the CPUC mapped 873.5 MW of solar.
3Take the draftA draft site screen for the land committee: sites, busbars near each, and a print sheet.
Demo dataLive CEC land-use screens and transmission lines, the CPUC 2026-27 busbar mapping, and USPVDB
StandardCPUC busbar mapping methodology (2025-09-30) · CEC land-use screens (2026-27)
Runs onStrata, or your existing Esri services
Built fromAn open recipe, in one run with Claude
On your own data
Want this on your own data?
We deliver it for you
We set it up on your data and your rules, load your first layers, and support it on Strata Hosted or Custom.
Delivery, licence and annual supportKeep exploring
All 4 Energy apps →Explore similar apps
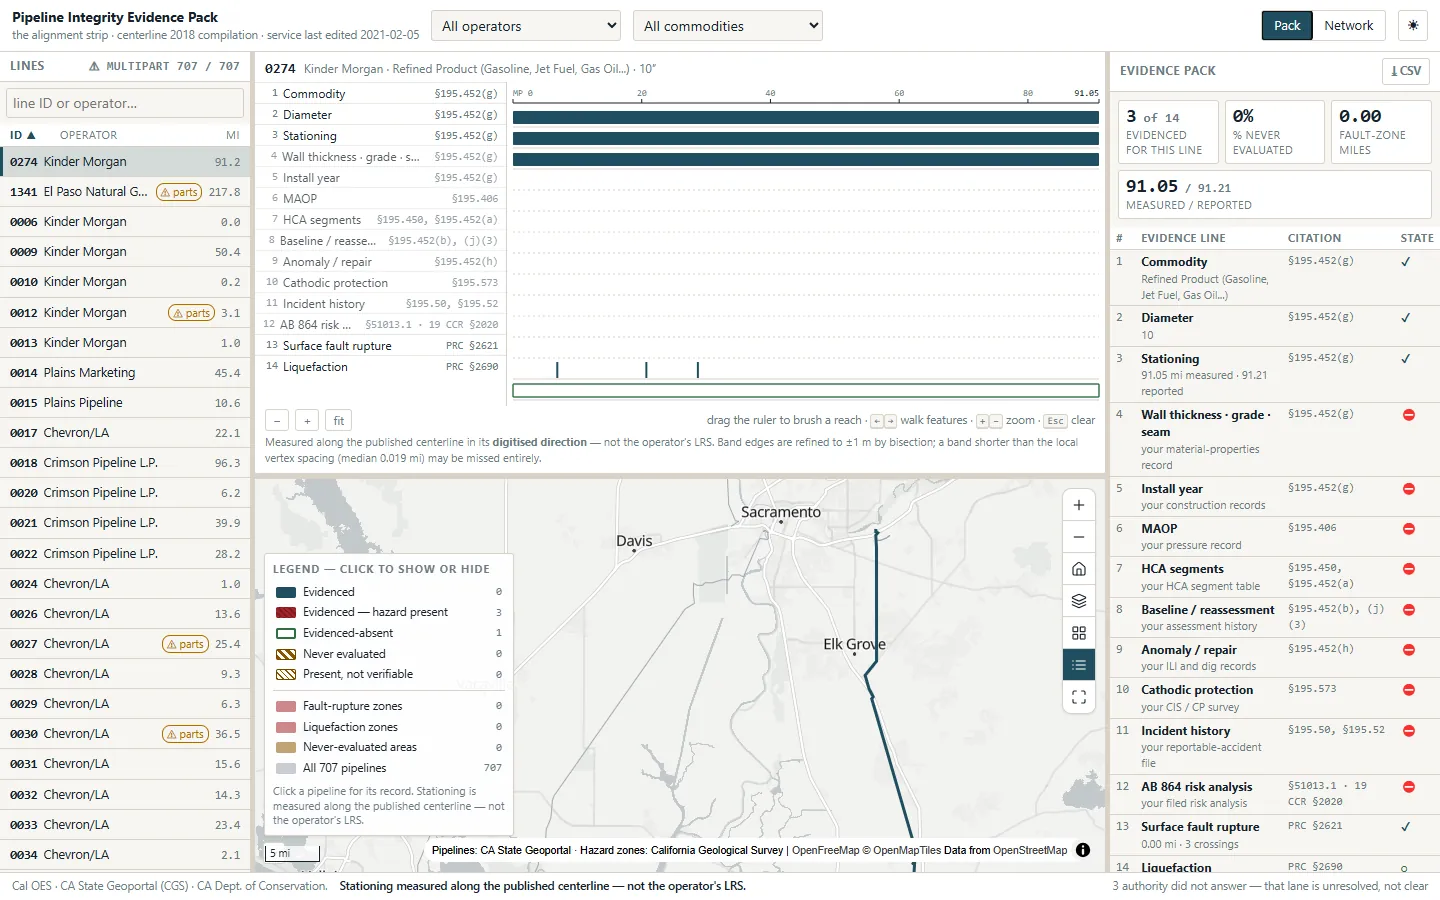
Pipeline Integrity Evidence PackWhat can we prove about this pipeline, milepost by milepost?See the app →
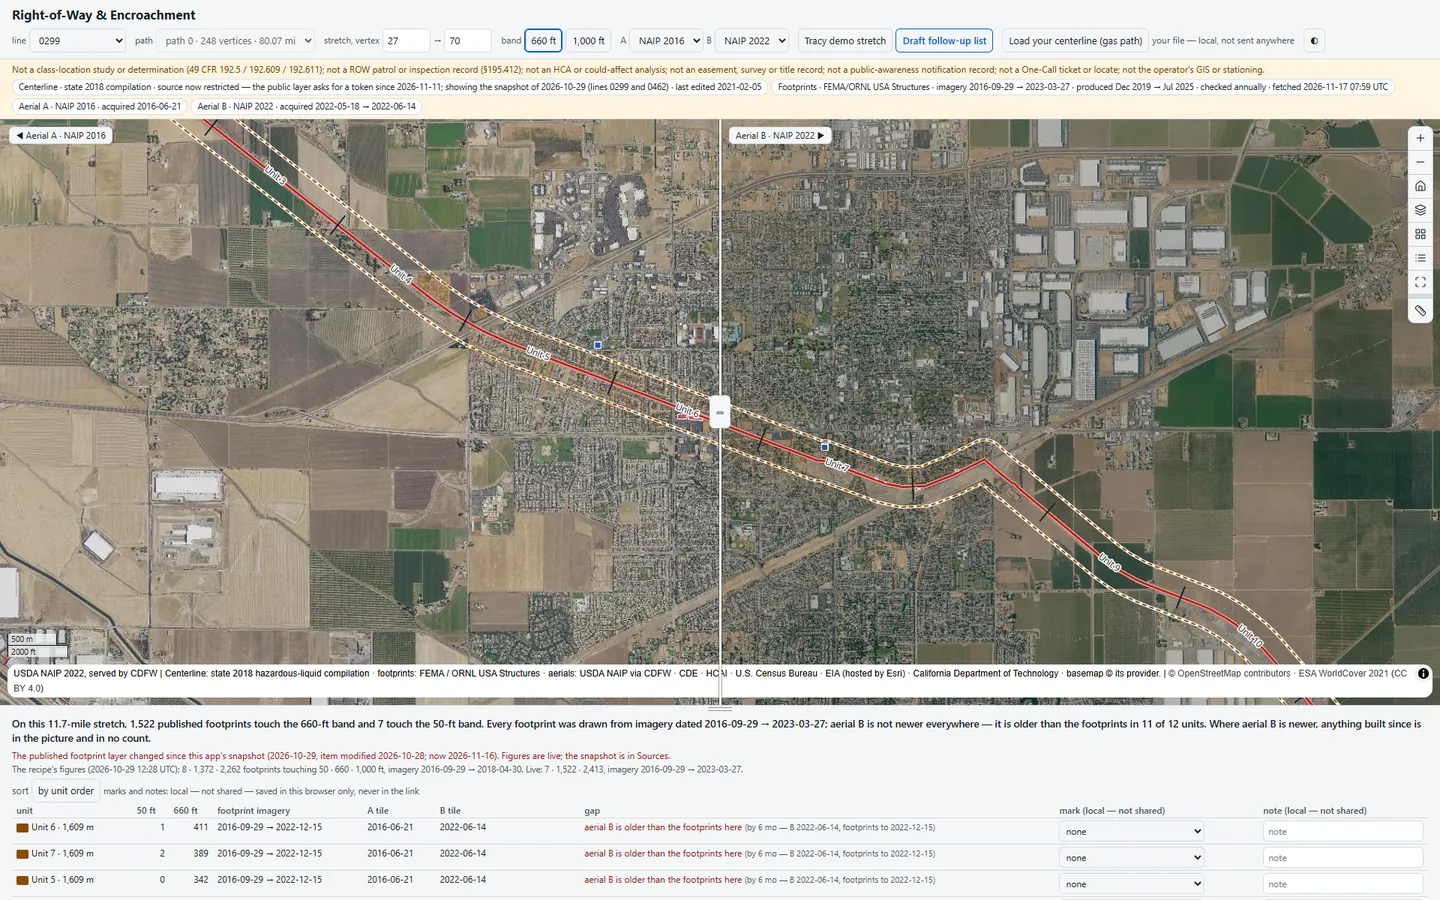
Right-of-Way & EncroachmentWhat has been built beside my line since the last class-location study?See the app →
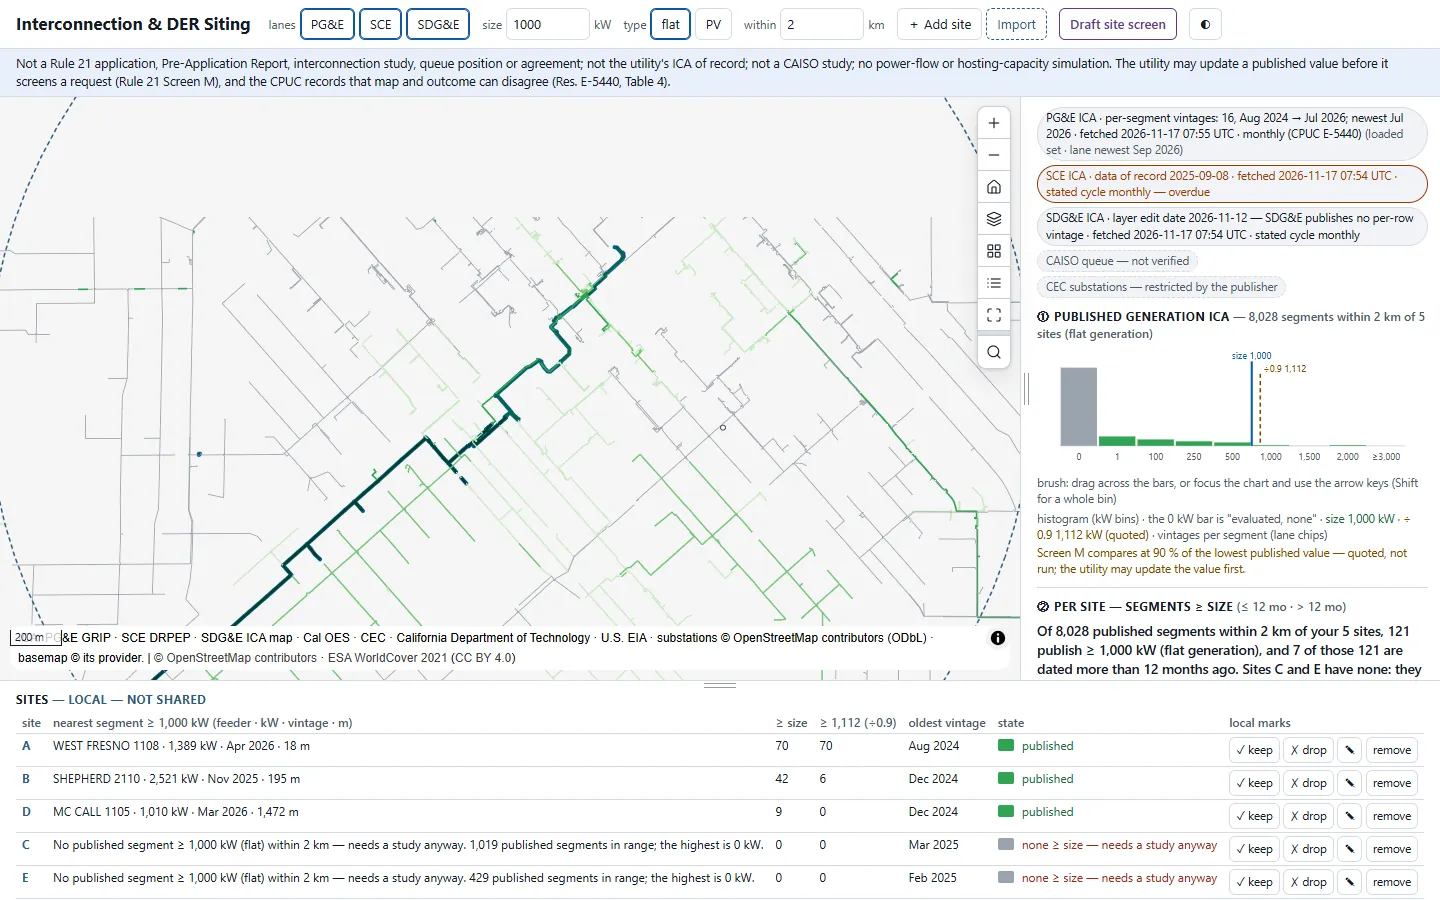
Interconnection & DER SitingWhich feeder can take my project before I pay a study deposit?See the app →