__MK__tabaqat · StrataReal Estate
Development Pipeline Tracker

Your plan says ninety days.
Half of similar projects there took over 2,215.

This board shows how long projects in each city or county have really taken to get from planning approval to building permit. It then shows how your own plan compares. It does not predict a delivery date.

California example · 540 cities and counties Built on official state housing reports
© 2026 Tabaqat · Built on Strata. Timing data comes from the annual housing reports California cities and counties file with the state. The eight sample projects are made up for the demo and labelled as such.
The decision this helps with

Should you re-phase a project, and which one?

A project can run late for many reasons. One of them is easy to miss: the city or county it sits in is simply slower than your plan assumed. That needs a different fix from a site or contractor problem.

The board answers one question for each site. How long have similar projects in that place actually taken, and where does your plan's assumption fall? It tracks the stages every California city and county must report each year: planning approval (entitlement), building permit, and certificate of occupancy.

For: development and land directors Also useful to: investment committees, lenders, JV partners
1 %of similar projects in Moreno Valley got from approval to permit within the sample plan's 90 days

Half of 1,120 similar projects there took longer than 2,215 days. The slowest one in ten took longer than 5,401. 87.6 % took more than two years.

In Fresno, nine in ten projects got their permit within 59 days. Two cities in the same state can differ this much, so the place matters as much as the project.

Why this is hard to find today

Existing tools answer a different question.

Type of toolWho it servesWhat it tracksDoes it show approval-to-permit time by city?
Construction lead databases
Dodge, ConstructConnect, permit aggregators
contractors and suppliers looking for workwhich projects exist, as early as possibleNo. They list projects, not how long approvals take.
Development management software
Northspyre, Rabbet, Procore
one developer's own projectsbudgets, draws, schedules, change ordersNo. A developer rarely builds enough in one city to compare.
National permit-timing data
Shovels
anyone who licenses the dataapproval and construction times across 20,000+ areasPartly. It measures the building-permit stage, and the data is licensed, so we cannot republish it.
This appthe person deciding whether to re-phasetime from planning approval to building permit, for each city and countyYes, using public state reports.

Cities publish how many projects they approve. They do not publish how long their approvals take. This board works that out from their own reports.

How the app looks

One screen: map, key figures and your projects.
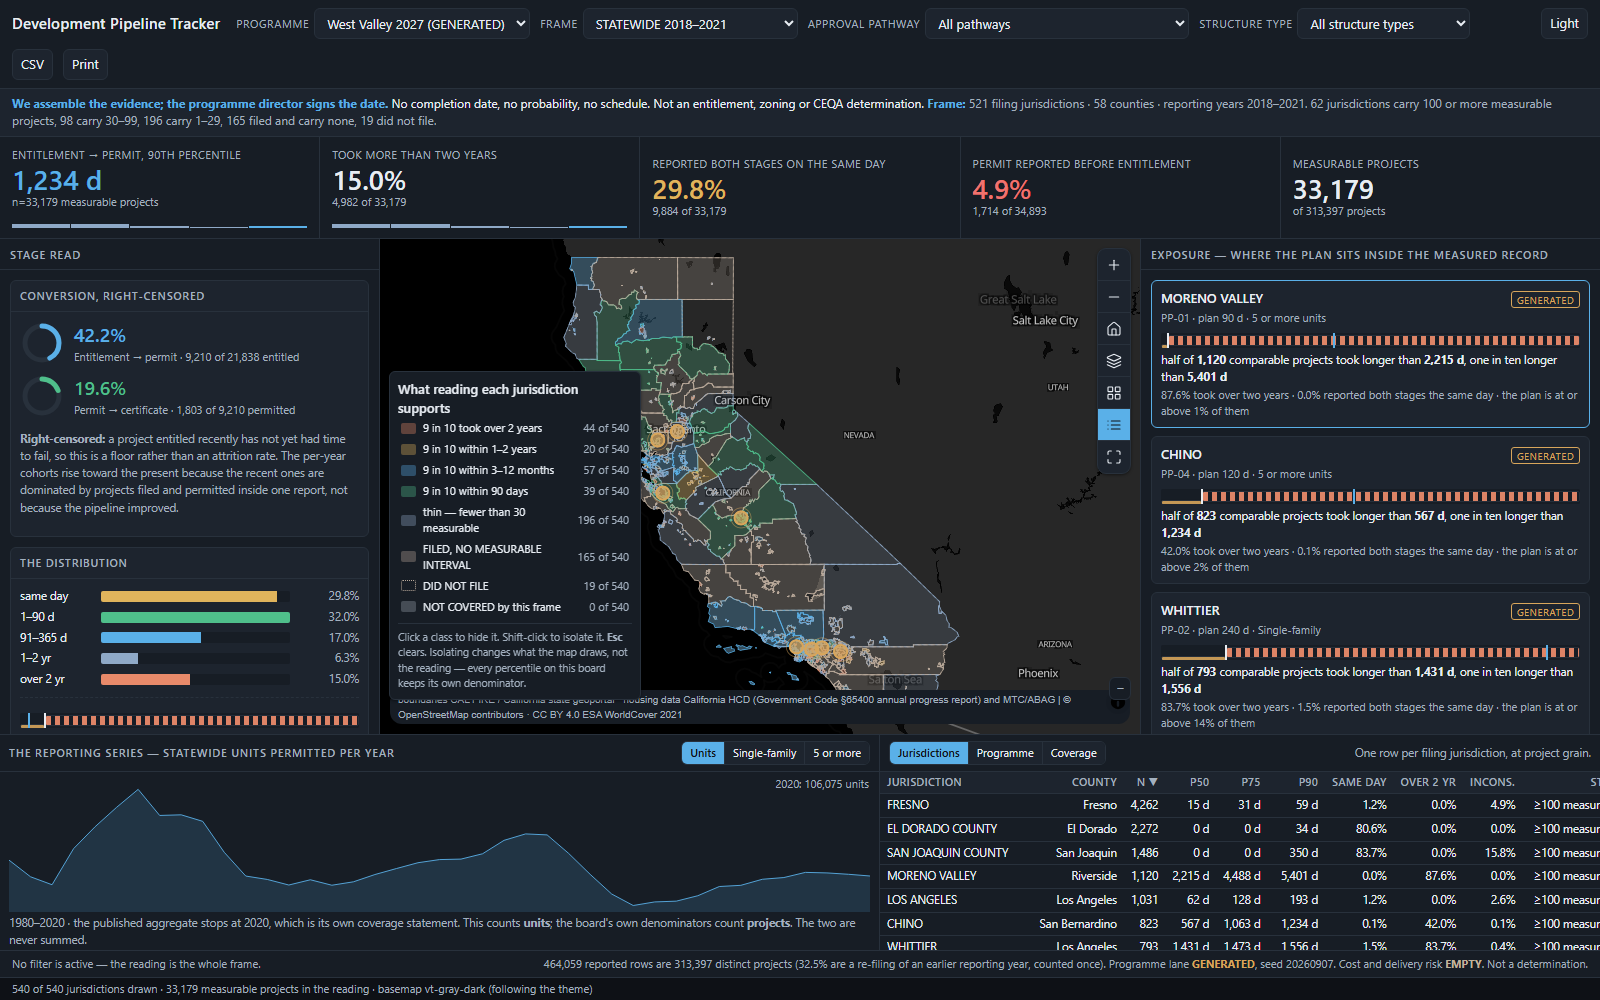
The Development Pipeline Tracker: key figures across the top, filters on the left, a map of California cities and counties in the centre, and the list of sample projects on the right.
Screenshot of the working app (dark mode). A light mode is also available.
  • Choose the period. All of California for 2018–2021, or nine counties with reports up to 2025.
  • Key figures at the top. How long the slowest one in ten projects took, the share that took over two years, and how many projects each figure is based on.
  • A map coloured by how much data each place has, and by how long its approvals take.
  • A clickable legend to show or hide each group on the map.
  • Your project list. One row per site, comparing your plan with that place's record.
Reading the map

Some places report well. Some report very little.

Big cities can have the least usable data

San Jose reported 3,248 projects, but none with both an approval date and a permit date. Sacramento is the same. Without both dates, no timing can be measured.

So the map shows how much data each place has

Of 521 places that filed a report, 62 have 100 or more measurable projects, 98 have 30 to 99, and 196 have fewer than 30. 165 filed but have none we can measure. Nineteen did not file.

Gaps are shown, not hidden

Places that did not file, and places that filed without usable dates, each have their own map style. A blank area is never shown as a fast one.

Slow: 9 in 10 took over 2 years44 of 540
9 in 10 within 3–12 months57 of 540
Thin: fewer than 30 projects196 of 540, read with care
Did not file19 of 540, never shown as zero

Each colour tells you how far you can rely on a place's figures. Where there is not enough data, the board shows no timing at all.

A worked example

Where your plan sits against the record.

For each site, the board shows what share of similar local projects got their building permit within the time your plan allows. It also shows how many projects that figure is based on.

Moreno Valley · plan assumes 90 days · 1,120 similar projects
half took longer than 2,215 days · slowest one in ten over 5,401 days
87.6 % took more than two years
= only 1 % finished within the plan's 90 days

How to read the bars: gold is the time your plan assumes. Hatched red is how long the slower projects in that place actually took. A short gold bar next to a long red one means the plan is likely too optimistic.

Your plan against the local record8 projects
MORENO VALLEYSAMPLE
PP-01 · plan 90 days · 5 or more units
half of 1,120 took longer than 2,215 days, one in ten longer than 5,401
87.6 % over two years · 1 % finished within the plan
WHITTIERSAMPLE
PP-02 · plan 240 days · Single-family
half of 793 took longer than 1,431 days, one in ten longer than 1,556
83.7 % over two years · 14 % finished within the plan
FRESNOSAMPLE
PP-03 · plan 90 days · Single-family
half of 4,262 took longer than 15 days, one in ten longer than 59
the plan's 90 days covers the full measured range
SAN JOSESAMPLE
PP-07 · plan 90 days · 5 or more units
NOT ENOUGH DATA. San Jose's reports have no projects with both dates, so no figure is shown and none is borrowed from nearby cities.
your plan actual record halfway point
Two of the eight sample projects are in places without enough data, and their rows say so.
Using the board

Click a project, see its city.
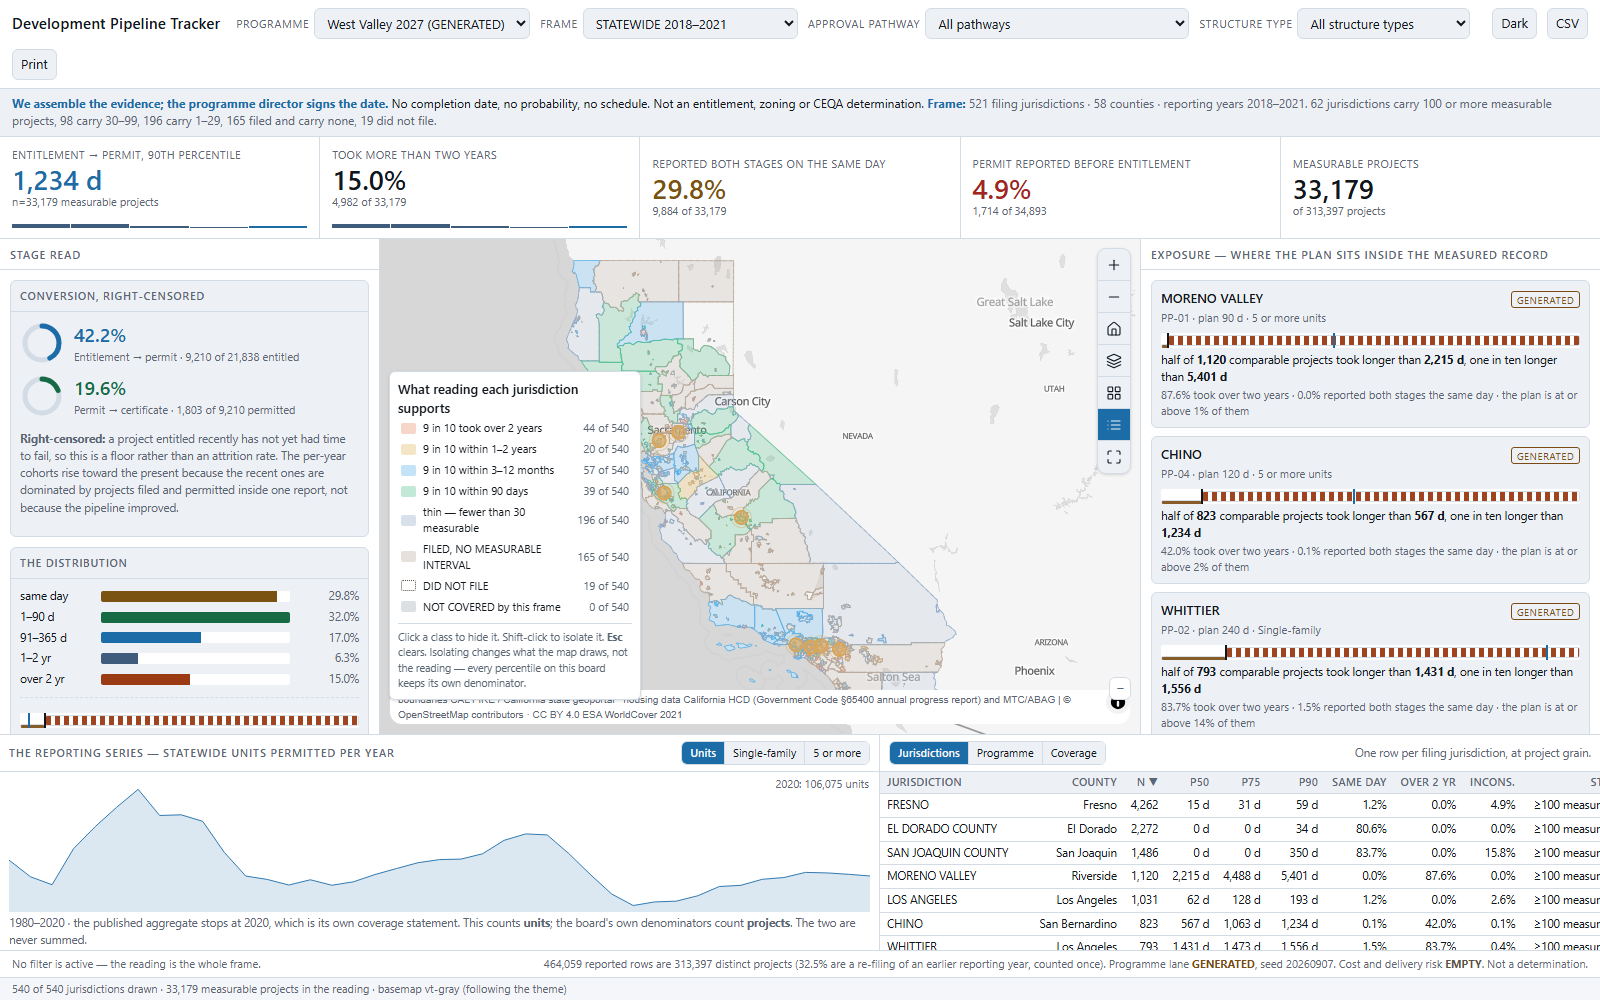
The same board in light mode, with the same map colours and project list.
Click a project in the list and the map zooms to its city, with that city's figures and chart. Click a city on the map and the list follows. Light mode shown.

Moving or zooming the map does not change the figures. They change only when you choose a place or a filter.

  • Period. The recent nine-county reports (to 2025) cannot be used to time stages. When you pick that period, the timing figures are removed and the board explains why.
  • Filters. Narrow by approval route and by building type, such as single-family or 5 or more units.
  • Each key figure opens to show how it was worked out.
Where the data comes from

Why you can trust the numbers.

Official reports

Every California city and county must send the state housing department (HCD) an annual progress report listing its housing projects and their approval and permit dates. The board reads those reports for 540 places: 483 cities and 57 county areas outside cities.

Each project counted once

Many projects appear in several years' reports. The board counts each one once, so 464,059 report lines become 313,397 projects. Every figure shows how many projects it is based on.

Same-day dates are flagged

About 30 % of reported projects show approval and permit on the same day. Some really were approved that fast. Others reflect how the form was filled in. So the board leads with the slower projects and always shows the same-day share next to the figures.

About the sample projects: the timing data is real. The eight projects in the demo plan are made up, based on published totals, and clearly labelled as sample data on screen.

Limits

What this app does not do.

  • No delivery dates or forecasts. It gives you the evidence. You set the dates.
  • No planning or legal findings. It does not judge zoning, entitlement or environmental review, or whether a city met any legal deadline.
  • No addresses or project names. Most records are homes, so these are removed.
  • No ranking of cities. A fast or slow figure can reflect local reporting habits as much as speed.
  • The statewide data ends in 2021. The newer reports (to 2025) cover nine counties and cannot be used to time stages.
  • No cost, financing, contractor or construction schedule data. No open California source publishes it, and the app does not make it up.
  • View only. It does not store or change your data.
  • English only.
Try it with your own plan

A list of your sites.
The time each plan assumes.

Send us the city or county for each site and the approval-to-permit time your plan assumes. Tell us how your project types match the report's housing categories. The public data is already loaded.

Not limited to California. The areas, stages and thresholds can be changed in settings. Wherever a government publishes similar approval and permit dates, the board can use them.

tabaqat.net → Solutions → Real Estate info@tabaqat.net
© 2026 Tabaqat · Built on Strata. Covers 540 California cities and counties, using the state's annual housing progress reports. Sample projects are made up. Not a forecast, and not a planning decision.
1 / 10